Introduction
I worked at Palo Alto Networks from 2020-2022. During my time there I primarily worked on designing two products
AIOps for NGFW, an ML powered product that provided insights into network and security issues
Activity Dashboards and Reports on Prisma Access - a suite of interactive dashboards to visualize network and security data
Palo Alto Networks is a cybersecurity company that offers advanced security solutions, including next-generation firewalls, cloud security, endpoint protection, and threat intelligence, to help organizations protect their networks, data, and cloud environments from cyber threats. They focus on providing innovative and effective cybersecurity technologies to defend against evolving threats and improve overall security posture.
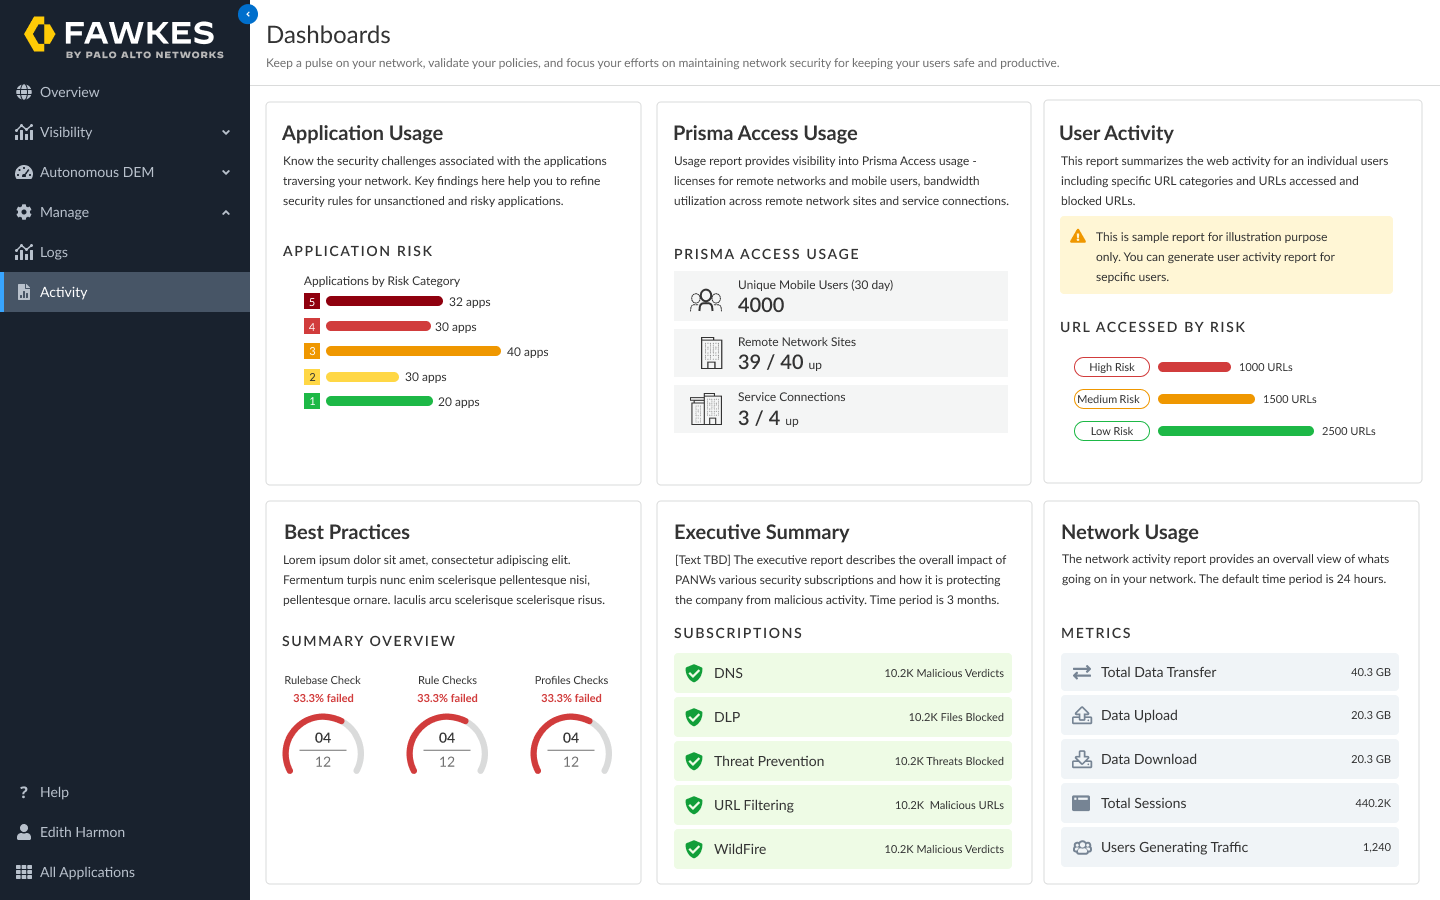
Activity Dashboards & Reports on Prisma Access
The Team
I collaborated within a team consisting of another designer, a product manager, and an engineering group. Collectively, we undertook a comprehensive overhaul of the user experience. I have showcased a segment of my contributions, which were exclusively my own.
My Work
I spearheaded the design efforts for five out of the eight key dashboards: User Activity Report, Usage Report, Network Activity Report, Executive Report & Search on IOCs. I maintained close collaboration with fellow designers, PM and the engineering team throughout the process. My responsibilities encompassed conducting user research, involving both internal and external stakeholders, leading design brainstorming sessions, contributing to product requirement documents, actively participating in the implementation phase with the engineering team, and overseeing quality assurance.
The dashboards garnered acclaim from both senior leadership and our end users. We closely tracked web traffic and user engagement to discern usability trends. Over the course of time, we observed a substantial upswing (+40%) in the utilization of these dashboards, including scheduled reports. Notably, the exceptionally interactive Network Activity and Search on IOCs dashboards experienced particularly robust usage.
The Problem
When I became part of the team, the initial PANW firewall reporting UI framework had been in use for over a decade. During that time, significant design and usability challenges had emerged, including:
A complex user interface that led to user frustration when attempting to generate reports.
Limited user experience (UX) copy resulted in a lack of context for external, non-technical users trying to understand the reports.
The overall visual design had become outdated and was no longer aligned with Palo Alto Network's modern design system.
Users were mainly consuming data without gaining actionable insights from it.
The data visualizations were basic and disconnected, making it difficult to correlate different data points.
Our objective encompassed the modernization of the dashboarding framework, aiming to establish a cutting-edge industry experience. Operating within the intricate realm of cybersecurity, our challenge lay in streamlining the report creation and scheduling process, alongside reimagining these reports for enhanced readability, effectively transforming data into actionable insights.
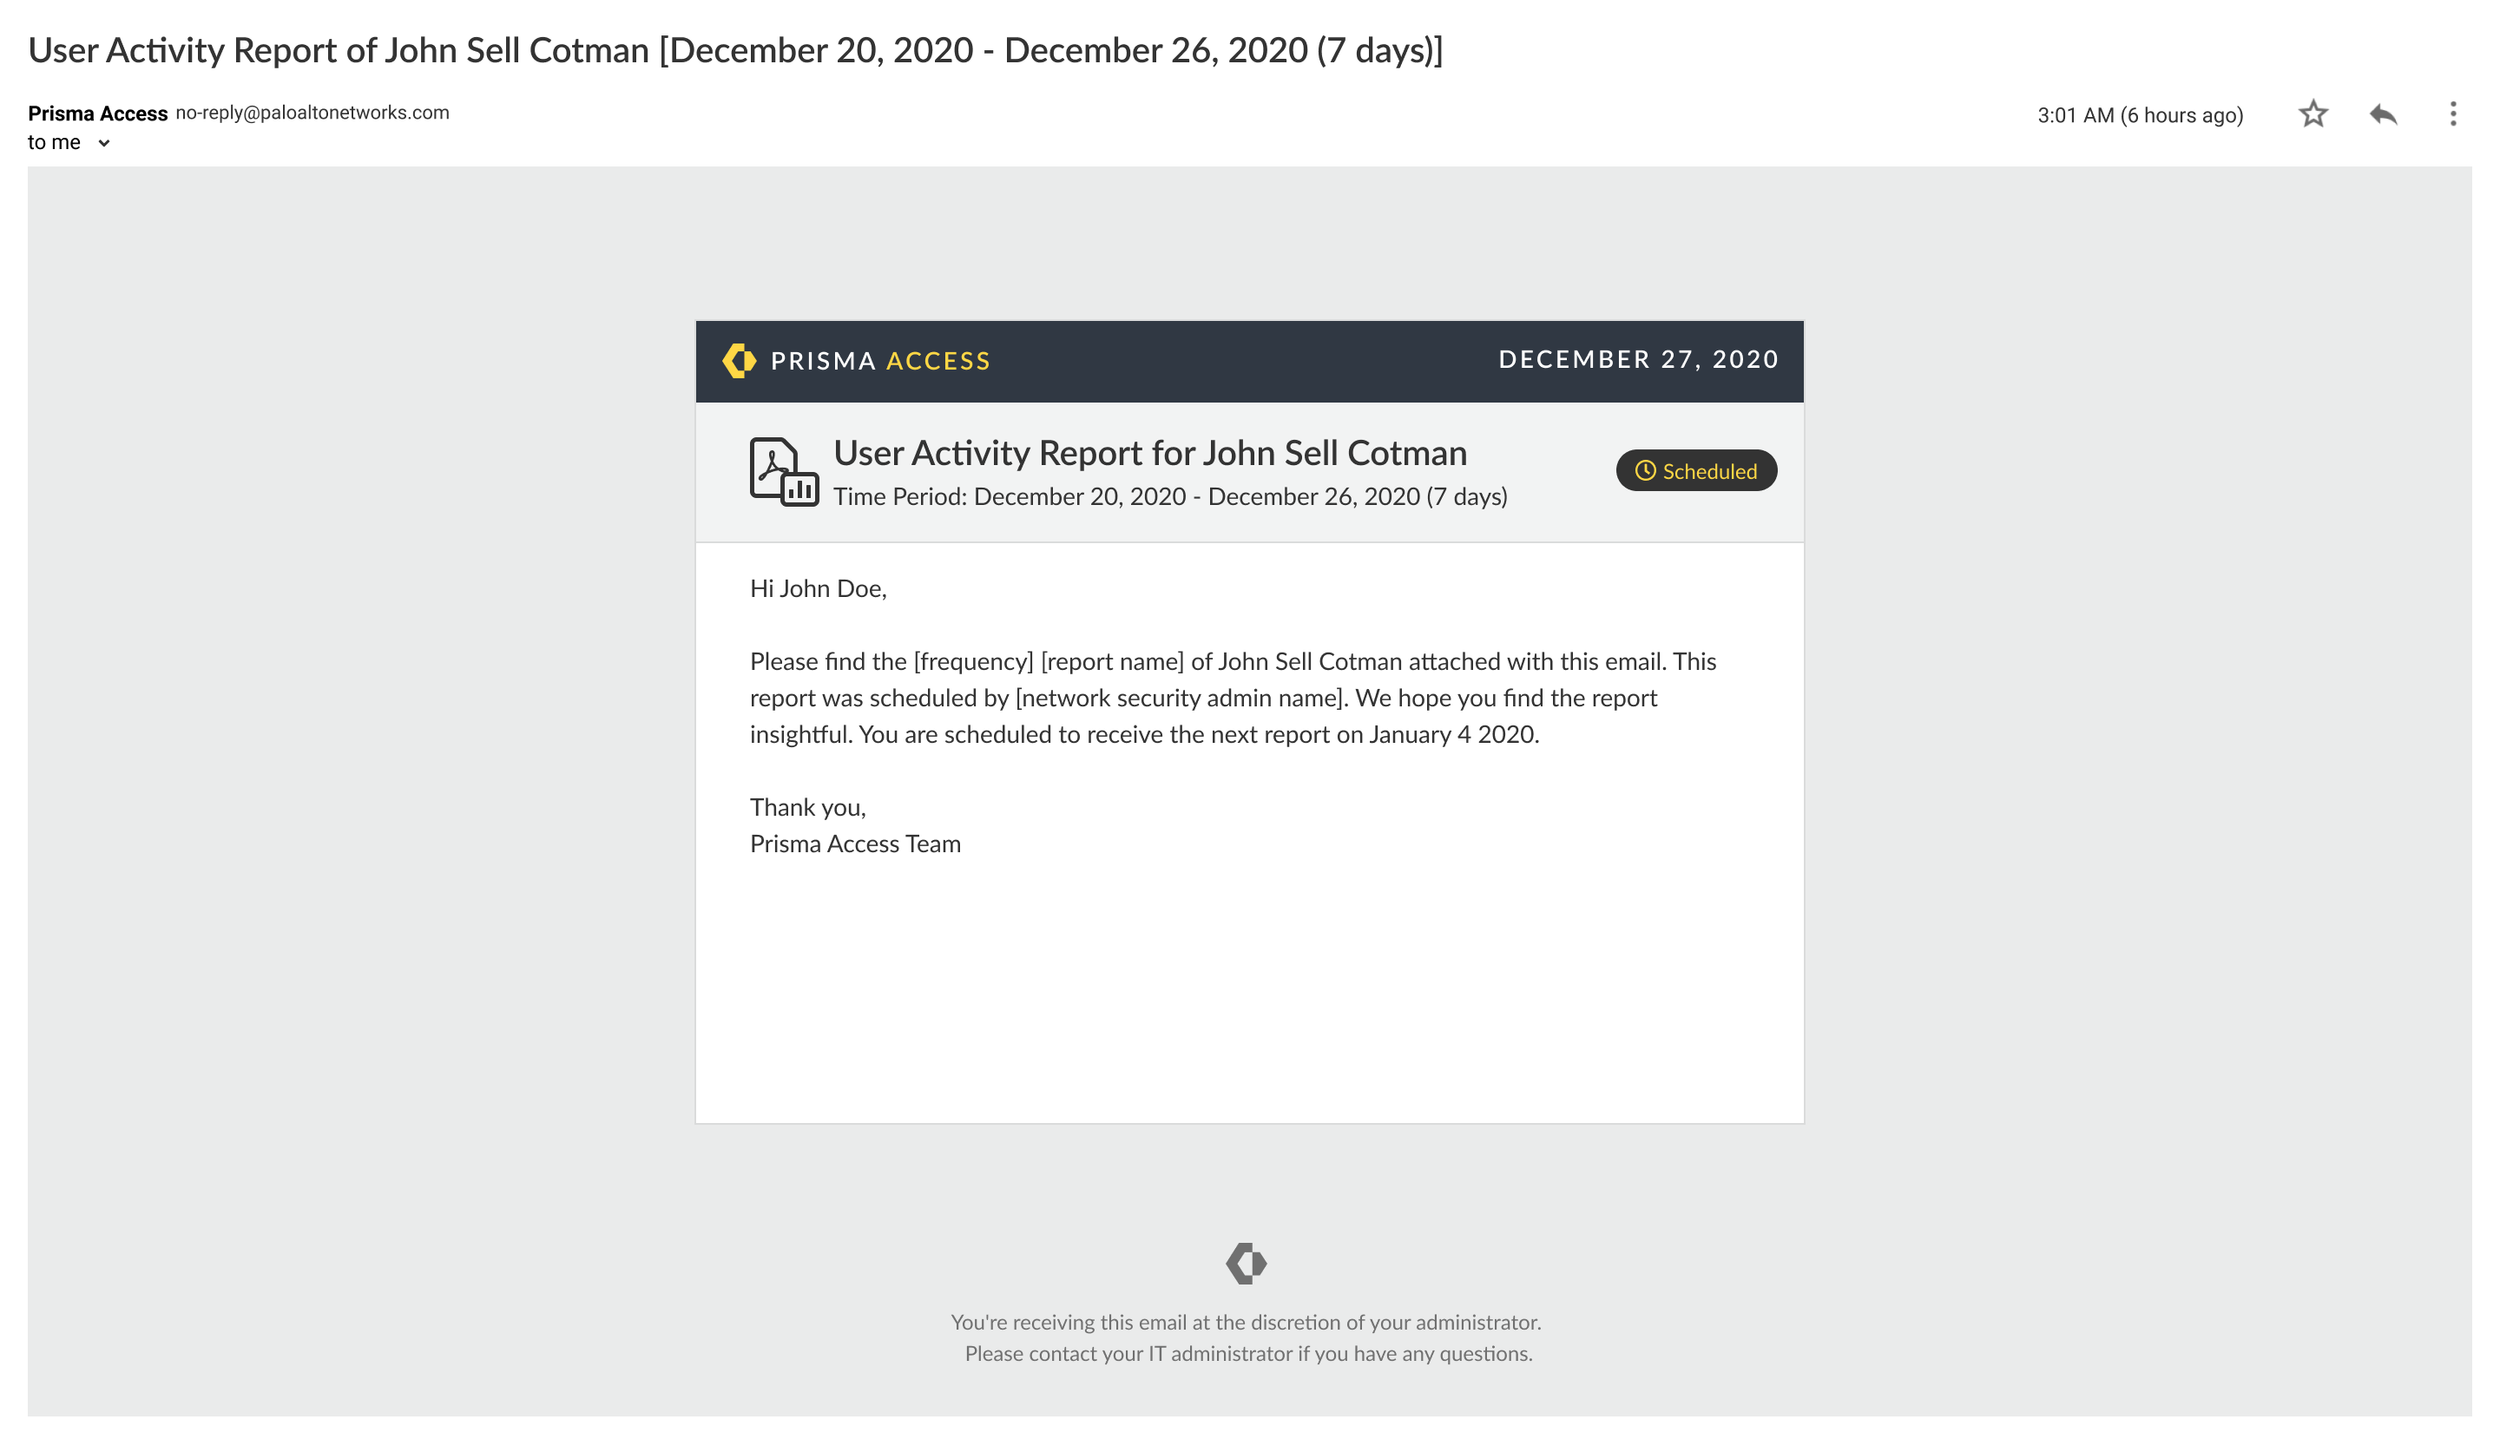
A fundamental requirement was that these dashboards are highly interactive to allow for data exploration workflows. At the same time, these dashboards should double as high-quality PDF reports for non admins to consume (CSOs,CIOs etc). This feature facilitated effortless dissemination across the organization, aligning with our vision for seamless sharing.

User Personas
Our focal user personas encompassed IT team members within both existing and potential client organizations. Predominantly, these personas consisted of network administrators and security administrators. Collectively, their core responsibility revolves around establishing a secure and reliable network environment for the employees of their respective companies.
These dashboards served as essential tools for these administrators, facilitating the investigation and resolution of issues, while also enabling the seamless generation of PDF exports for dissemination among fellow team members as well as executives. Administrators possess an elevated level of technical expertise and typically possess an extensive knowledge of network and security systems.

Output
My deliverables included mockups and interactive prototypes for five dashboards, complemented by their corresponding PDF versions. In addition, I played a pivotal role in shaping the design of the landing page and contributed to the development of email templates designed for scheduled reports. Noteworthy contributions included:
Designing data visualization components in Figma, which were subsequently integrated into the "Palo" Design System. This initiative not only expedited the design process for fellow designers but also bolstered visualization design consistency.
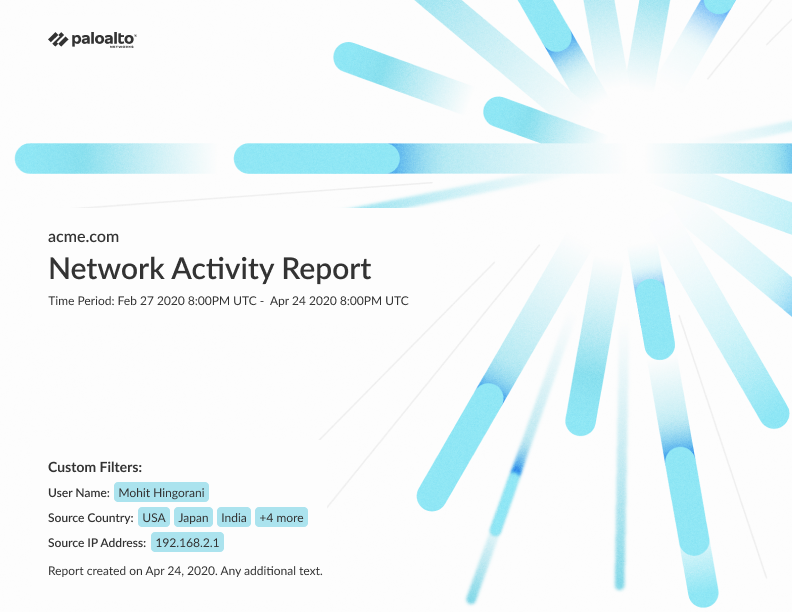
Successfully advocating for the team to standardize the size and orientation of reports in landscape format, resulting in a noteworthy reduction of engineering time. Previously, engineers had been expending effort recreating code for PDFs, particularly for portrait orientation. This standardization enabled the reuse of existing work, maintaining consistency in the process.
Collaborating with the branding team to create cover pages, integrate blogs into PDF reports, establish guidelines for page layouts, and formulate design patterns. This concerted effort significantly streamlined the efforts of both the design and engineering teams, concurrently elevating the overall user experience.
Reporting UI


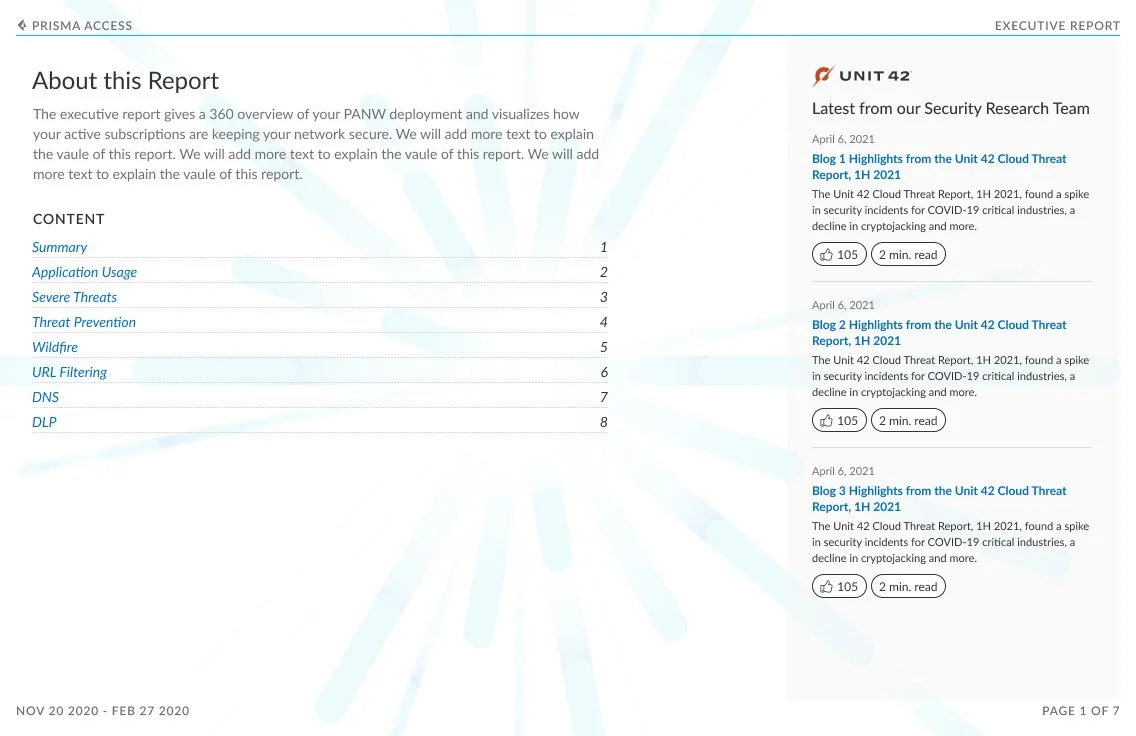

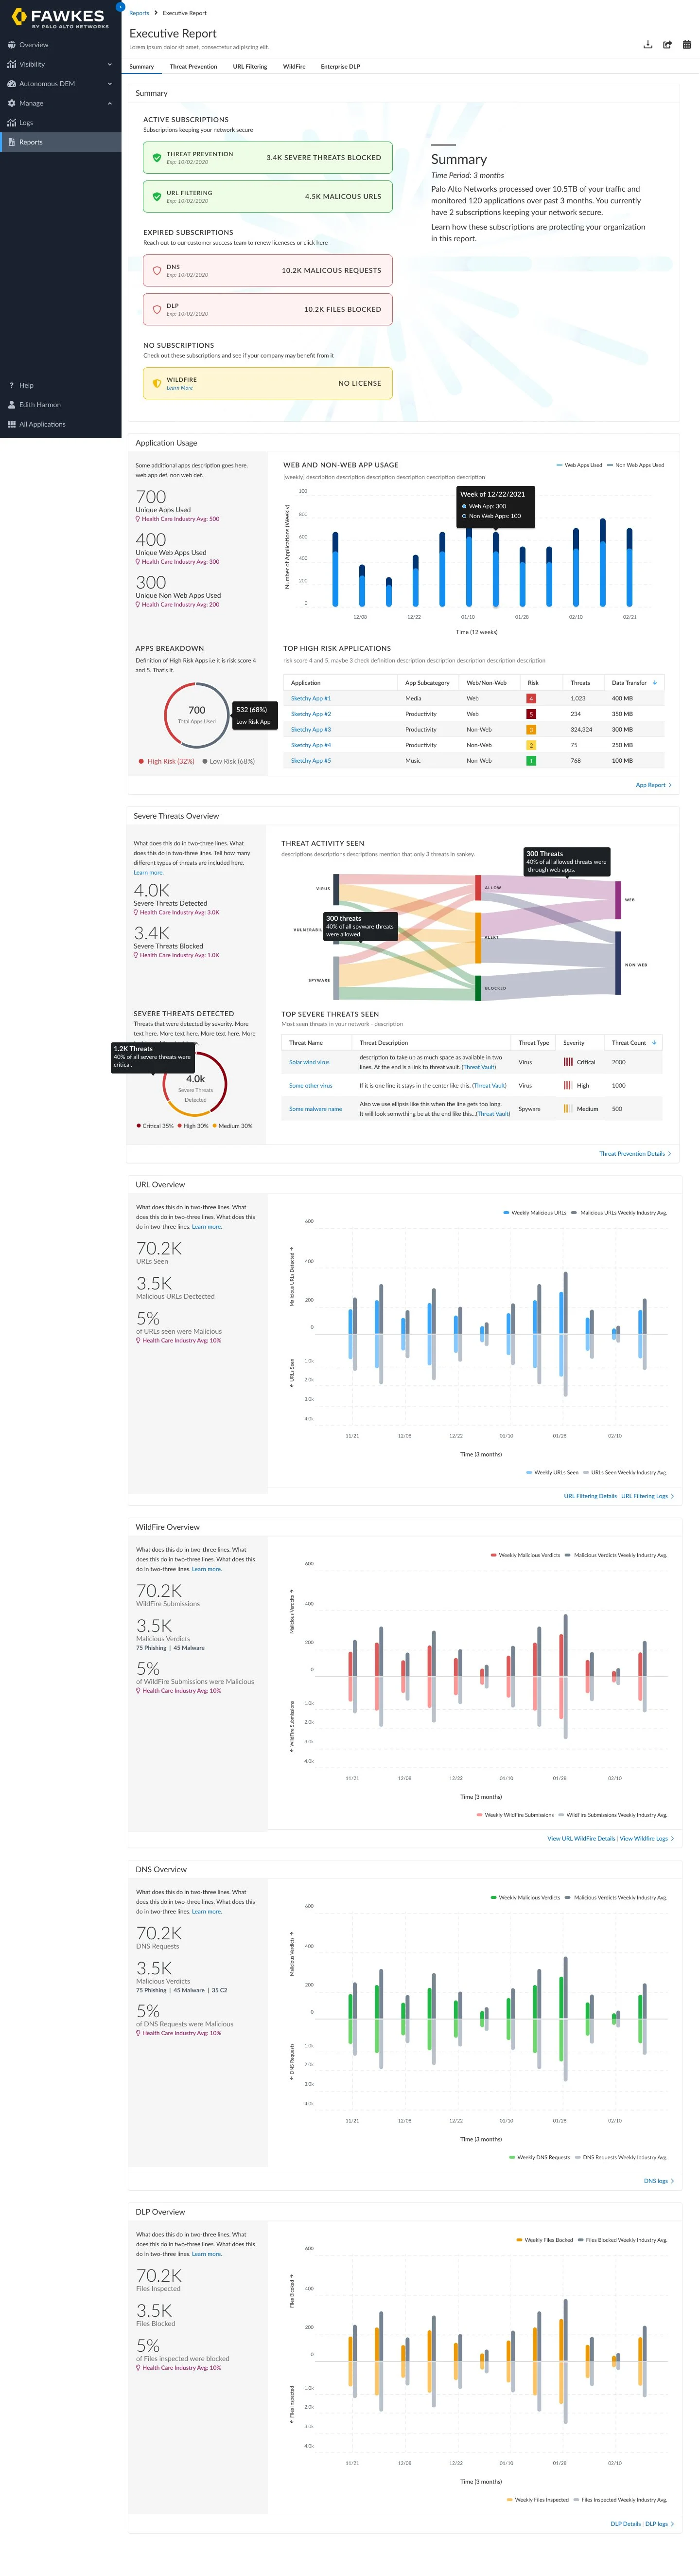
Executive Summary
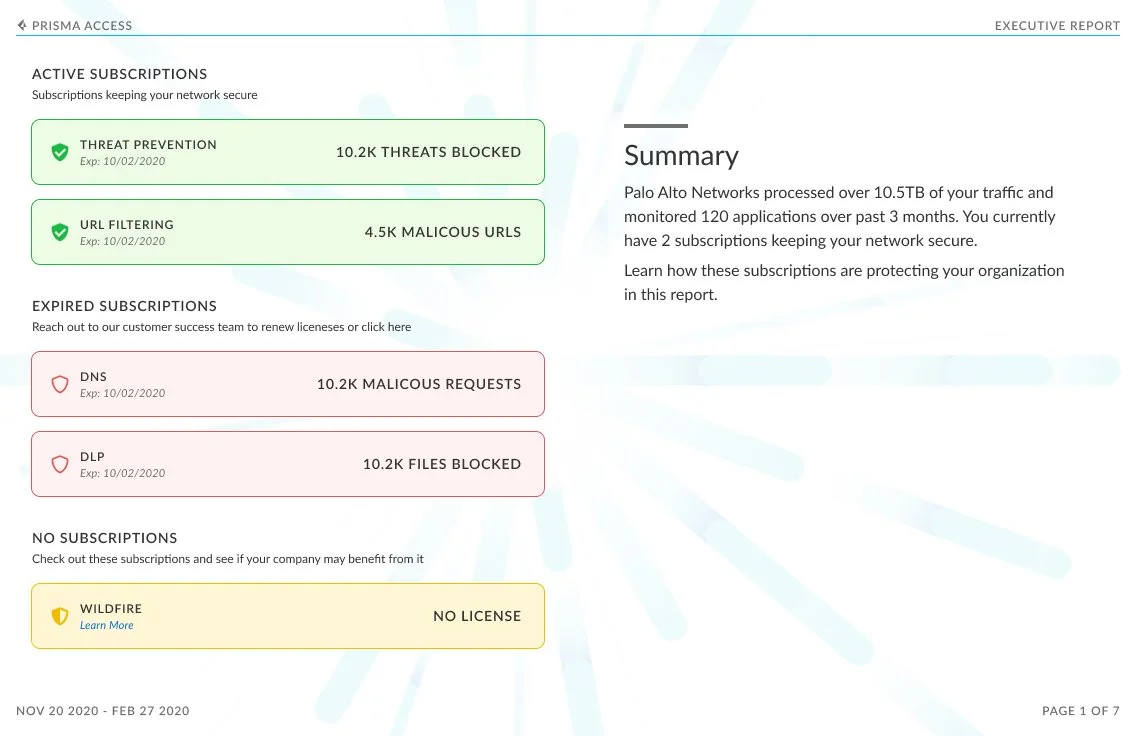
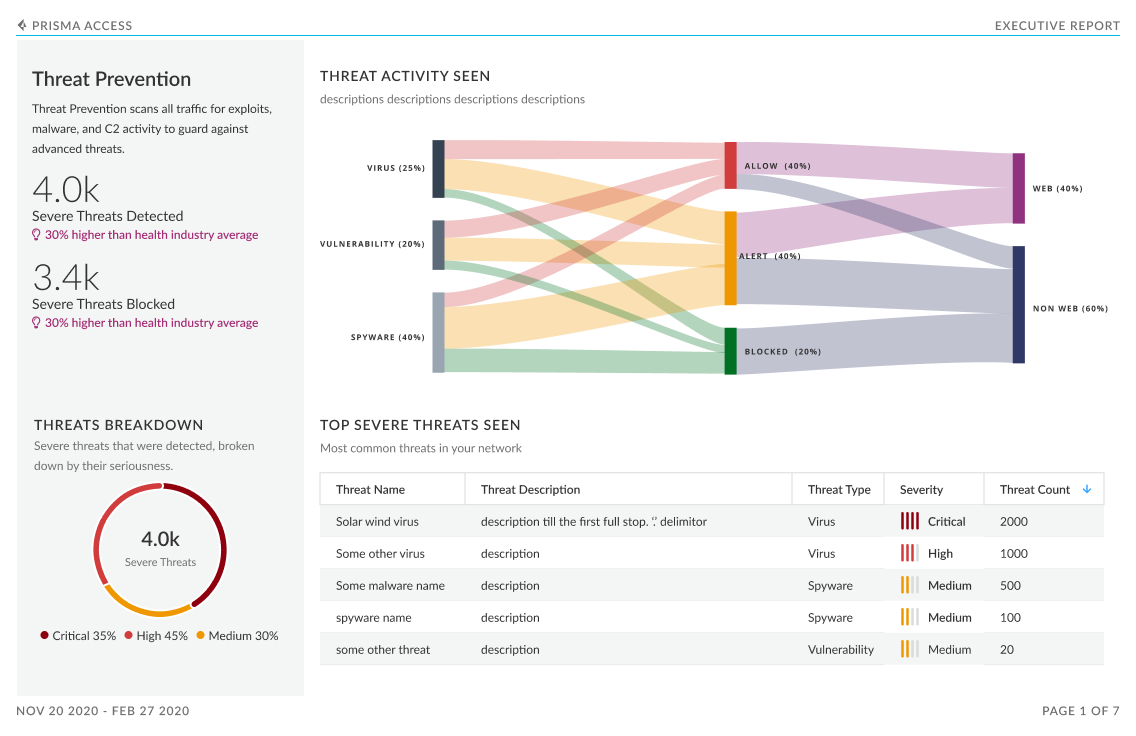
The executive report was designed to provide C-level executives an overview of how Palo Alto Networks is protecting their company’s network. The report provides an overall view of companies subscriptions that are active and provides insight into the ones they could purchase. Further this report showcases the value of these subscriptions by showing the malicious activity your subscriptions are detecting and preventing:
high-risk applications
severe threats (exploits, malware, and C2)
malicious web activity
file-based threats (including never-before-seen threats)
data loss
Additionally, peer data in this dashboard gives a view into your industry’s threat landscape and how the security coverage compares to similar organizations. This industry data is also shown for subscriptions that are not active; this helps to see if there are places where increase in coverage can help close security gaps.

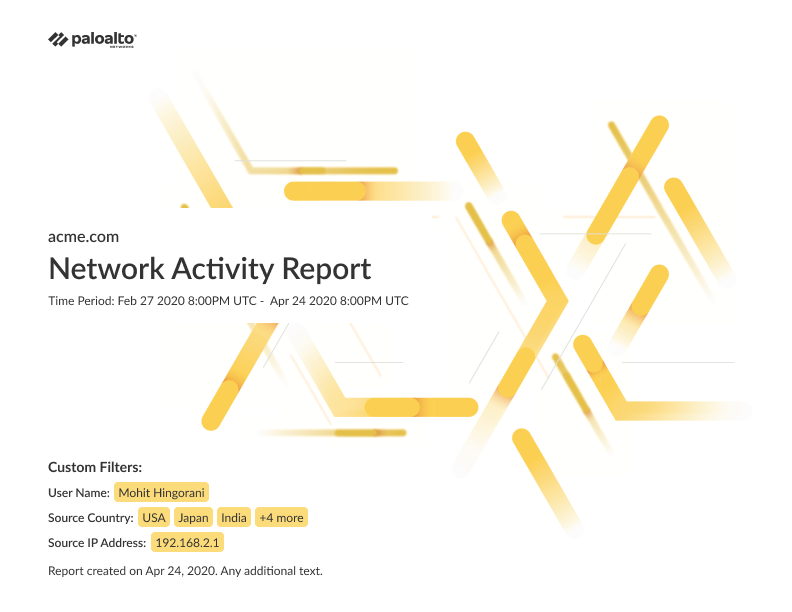
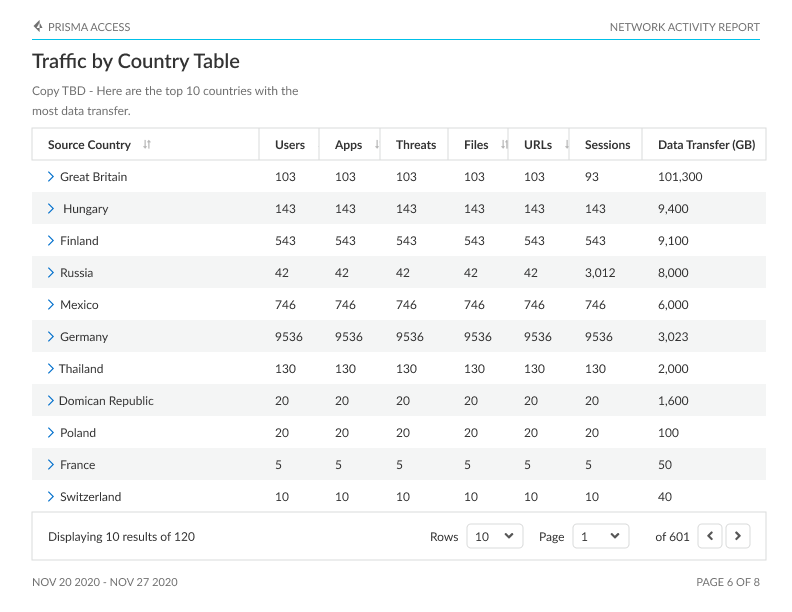
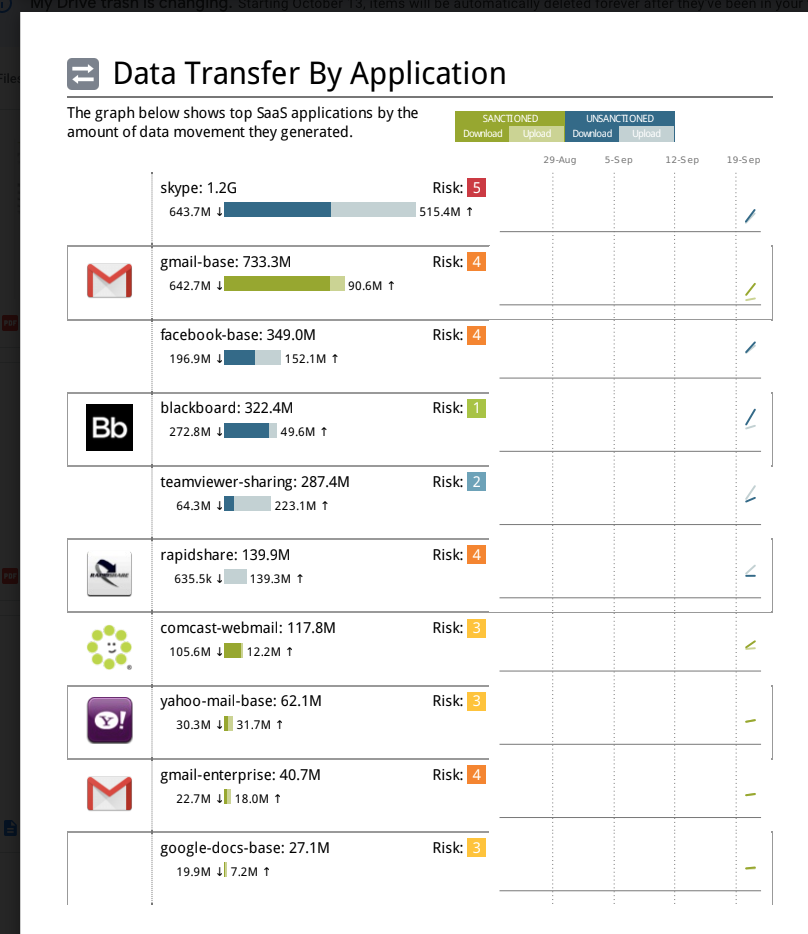
Network Usage Report
The Network Usage Dashboard (Activity Network Usage) is a comprehensive tool providing a window into the fundamental drivers of network traffic. This dashboard allows users to delve into the identification of contributors to network activity, encompassing users, applications, IP addresses, and countries, along with the specific apps and sites accessed and potential exposure to threats.
Key features allow users to:
Gain insights into the internal workings of network traffic, encompassing data from source to destination, as well as identification of users and IP addresses that generate this traffic.
Make use of interactive drill-down functionalities, enabling the filtering of attributes such as IP address, username, and source location, thereby facilitating a more intricate and detailed analysis.
Access the Log Viewer seamlessly through contextual links, facilitating the review of comprehensive log records closely associated with dashboard data and related activities.
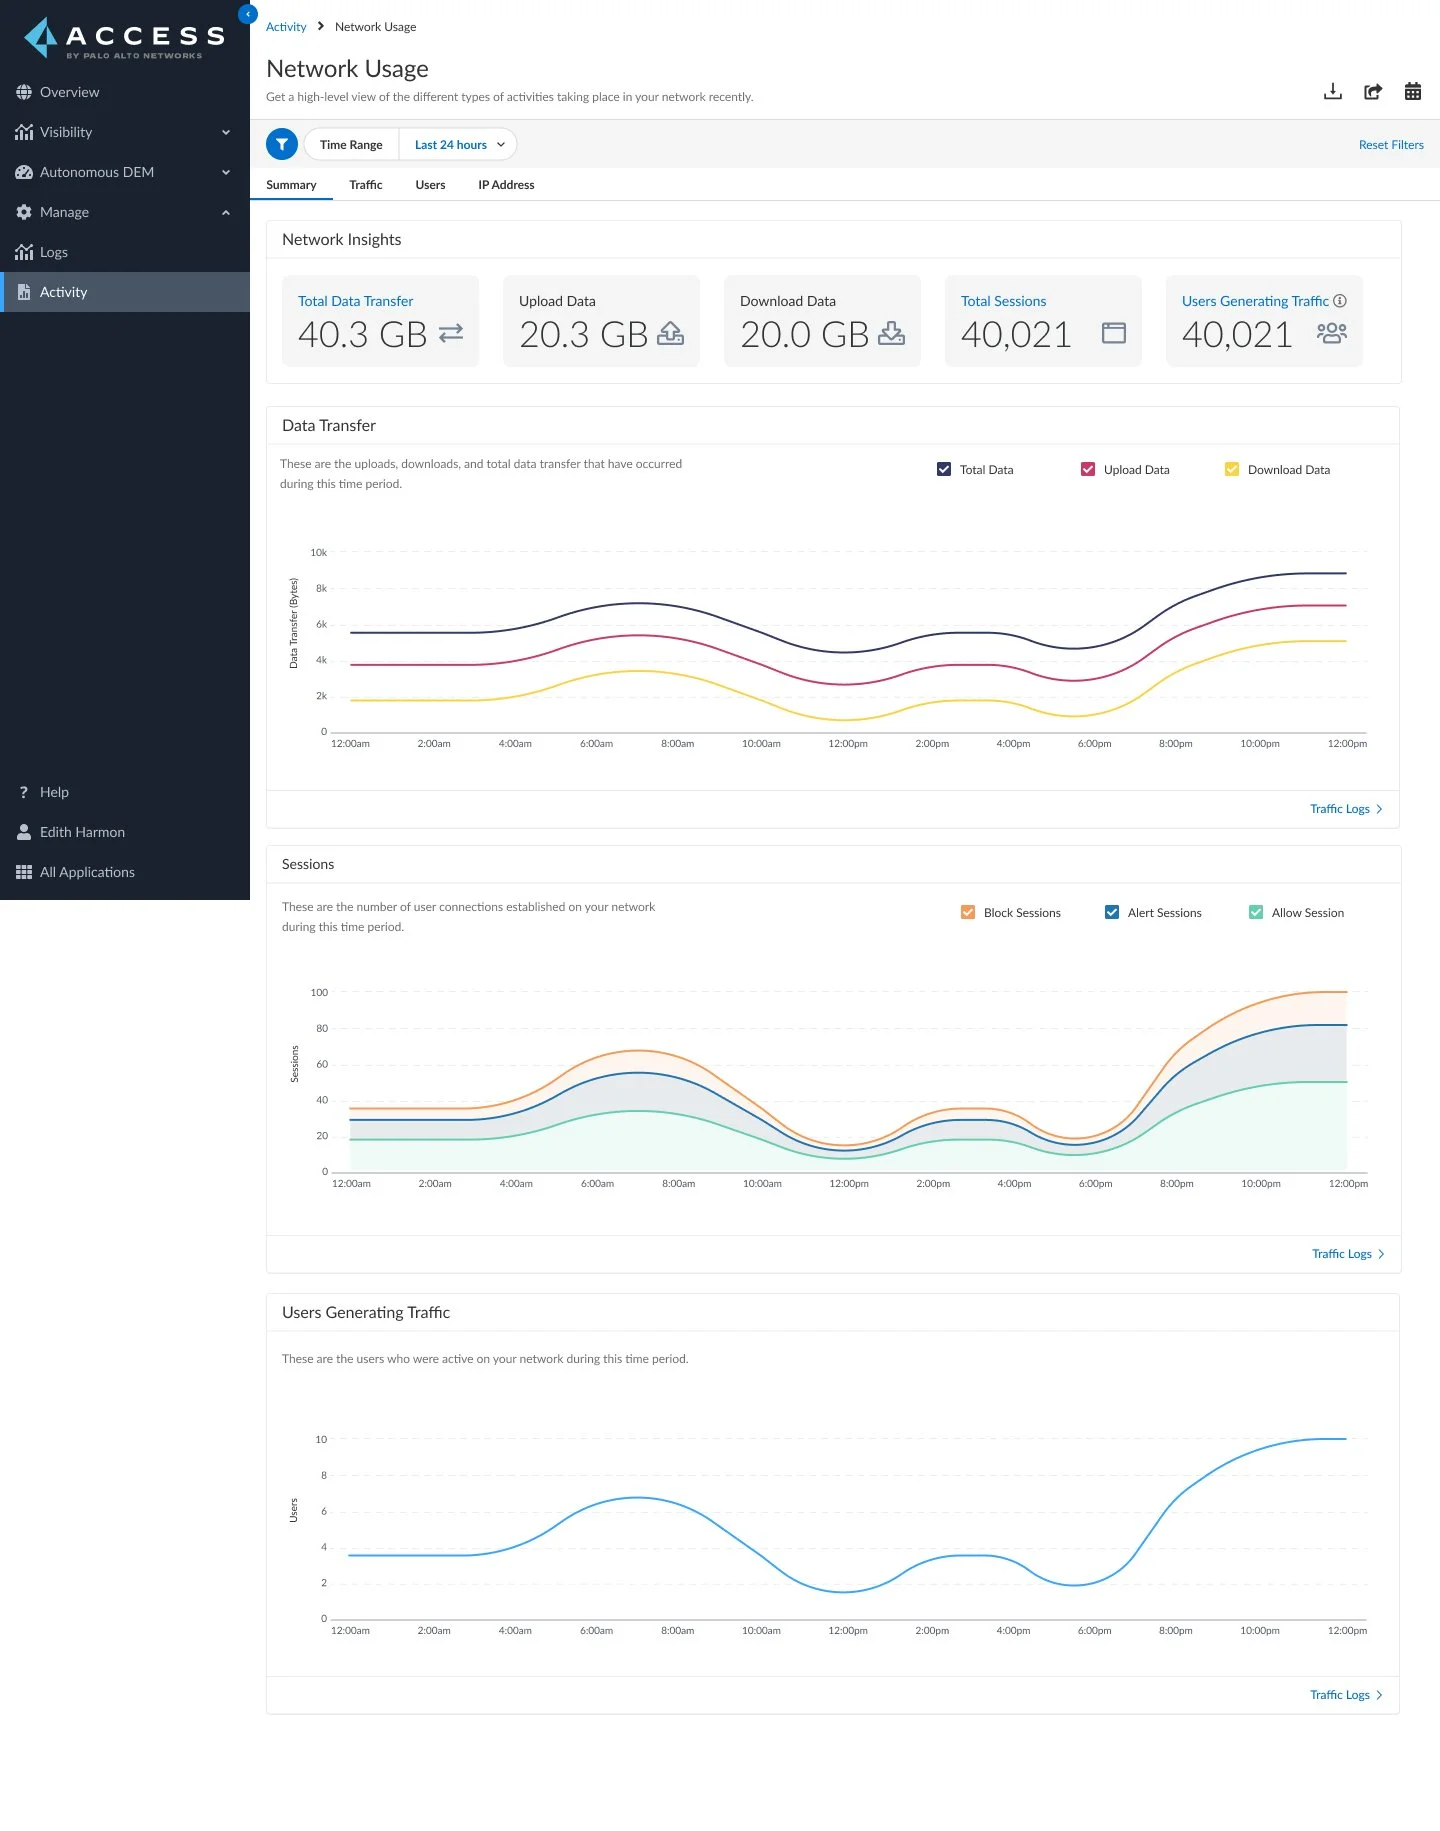


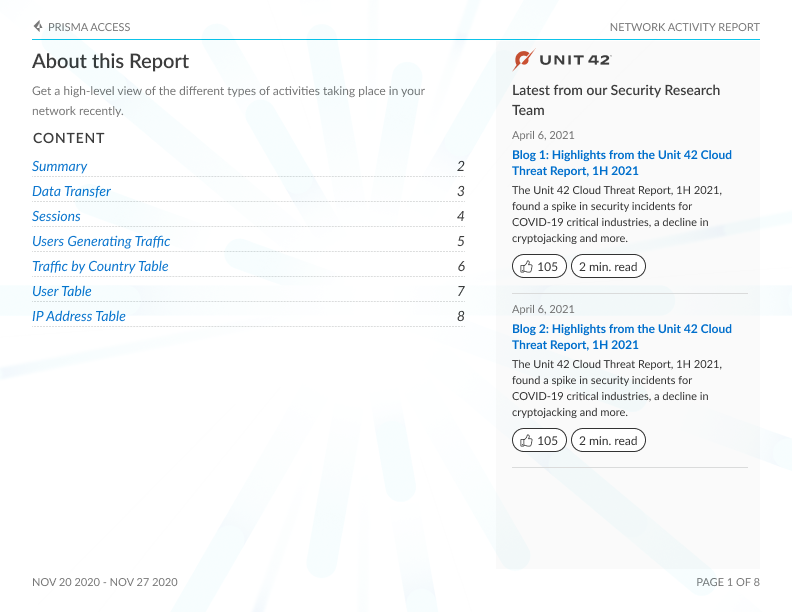
Dashboard Sections:
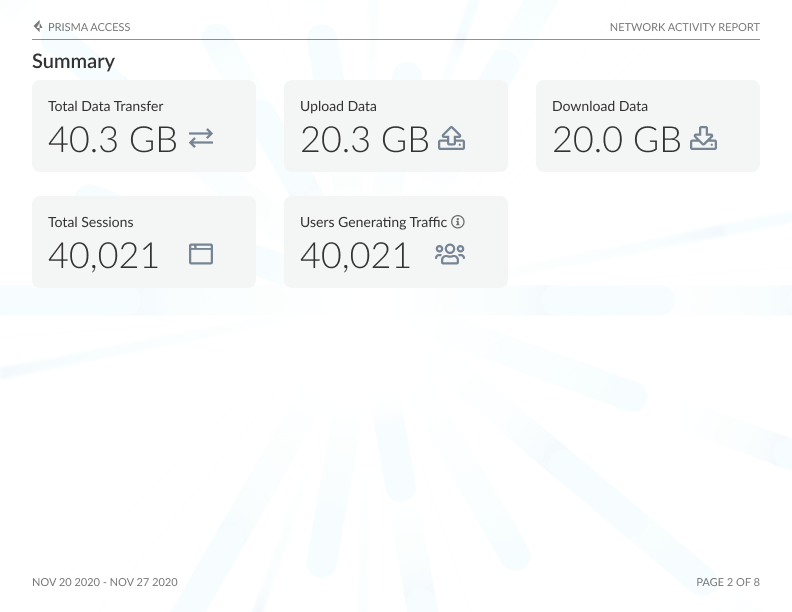
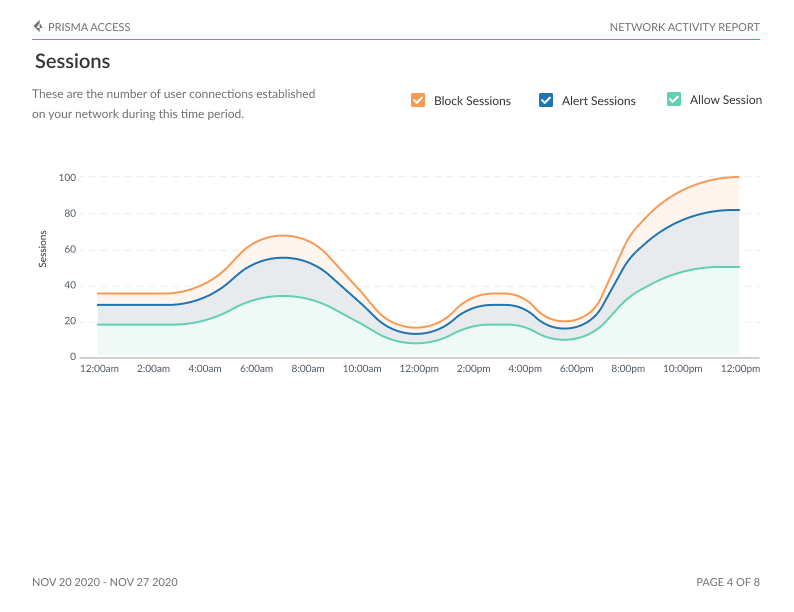
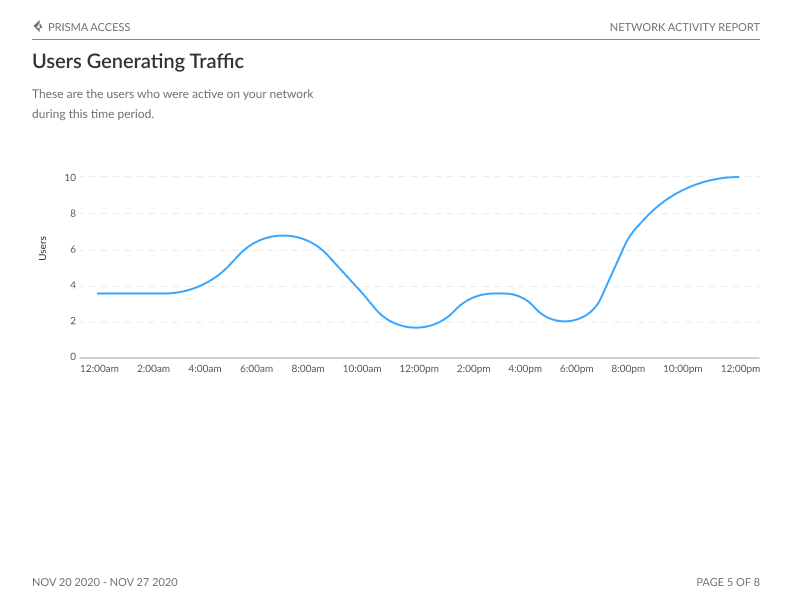
Summary: Network insights, including total data transfer, uploads, downloads, sessions, and the number of users initiating sessions on your network.
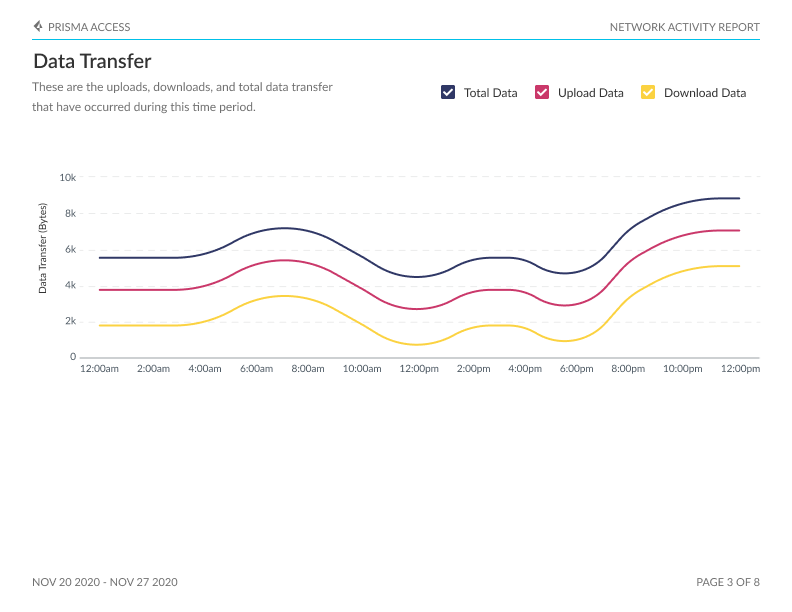
Traffic: Visualize the countries where your network traffic originates, as well as the countries with the highest user counts, app usage, threat occurrences, file transfers, URLs accessed, sessions initiated, and data transferred.
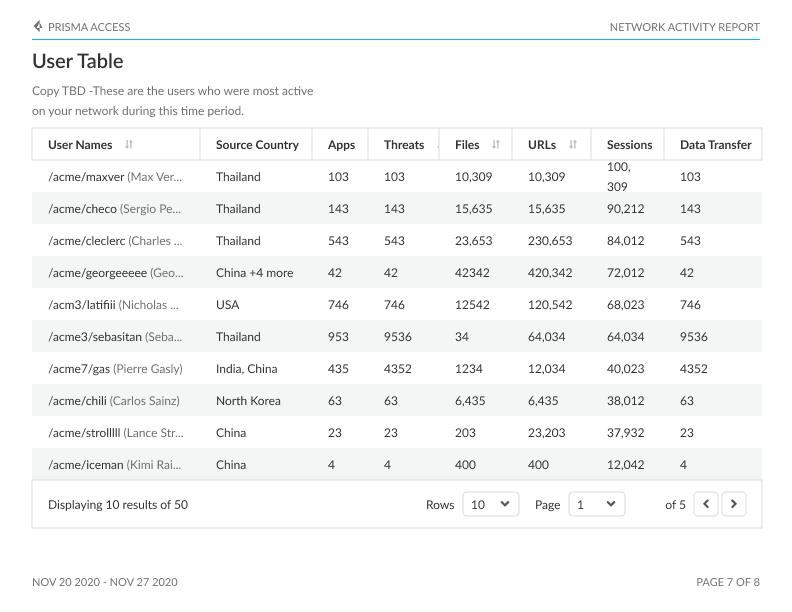
Users: Identify the users initiating traffic on your network, along with the associated countries, apps, threats, files, URLs, sessions, and data transfer linked to their network activities.
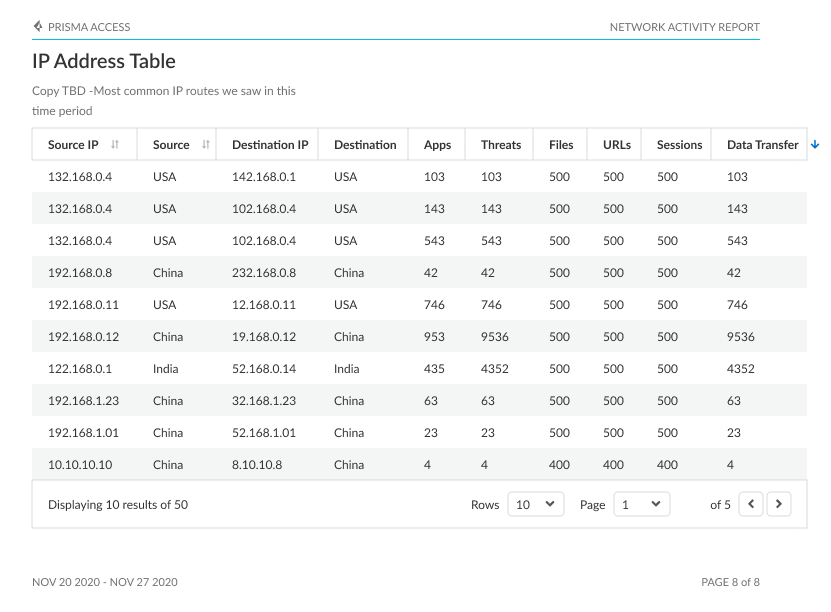
IP Addresses: Observe the source IP addresses driving traffic on your network, along with associated countries, users, apps, threats, files, URLs, sessions, and data transfer.
With the Network Usage Dashboard, the user gains access to essential tools for enhanced comprehension and optimization of network traffic, all while maintaining awareness of potential security risks. In possession of this potent and enlightening resource, informed decisions can be made based on data, enabling proactive measures to stay ahead in the realm of network management.
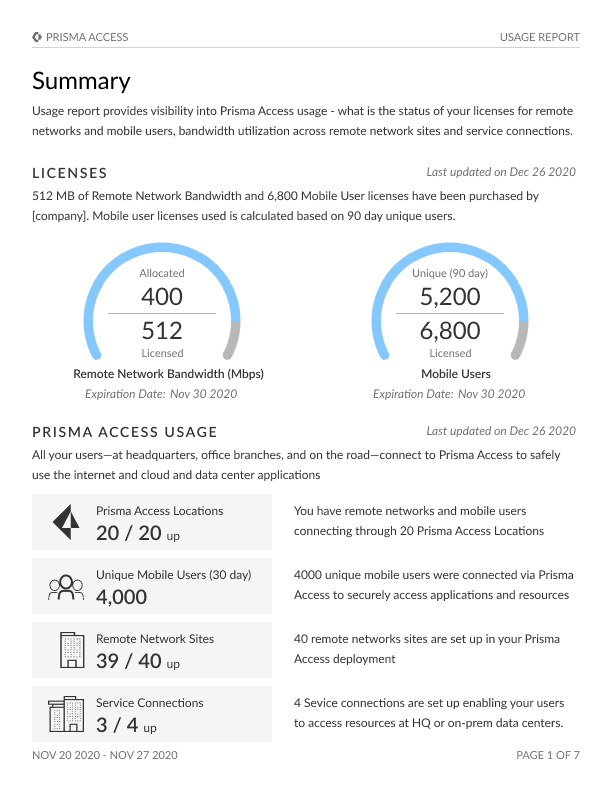
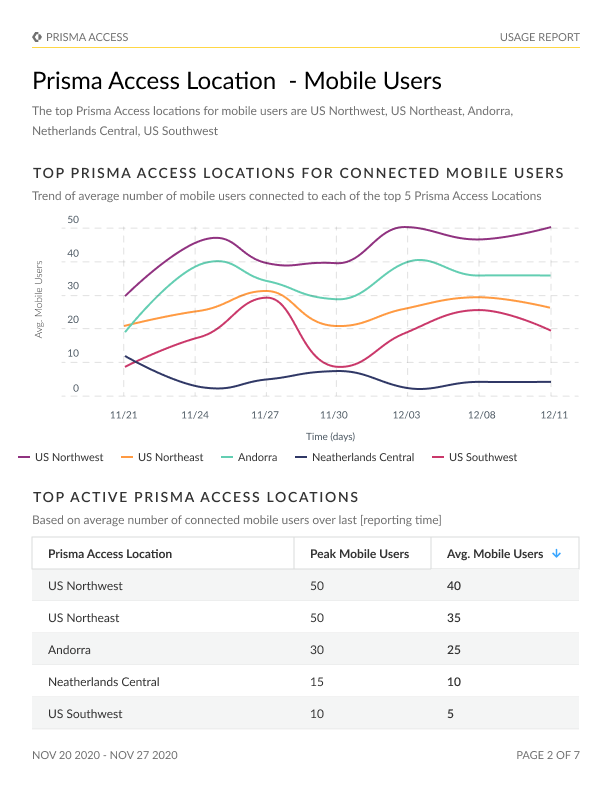
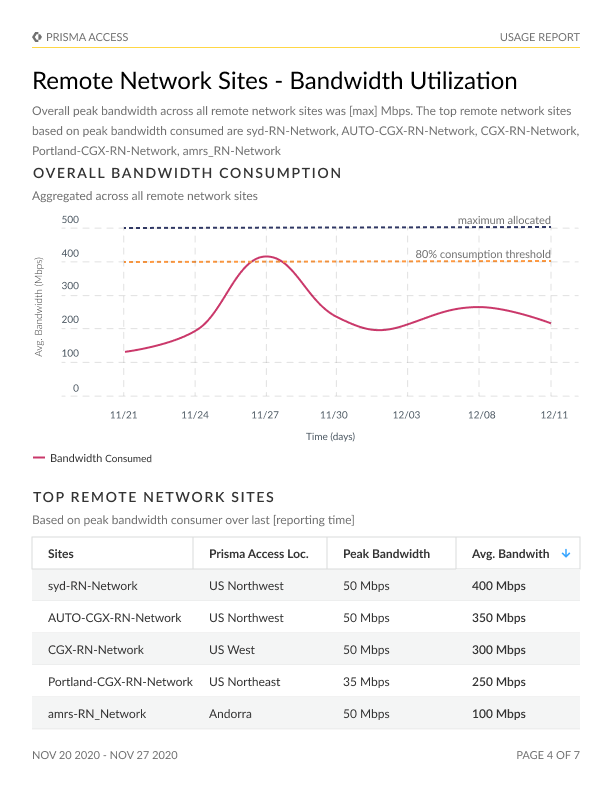
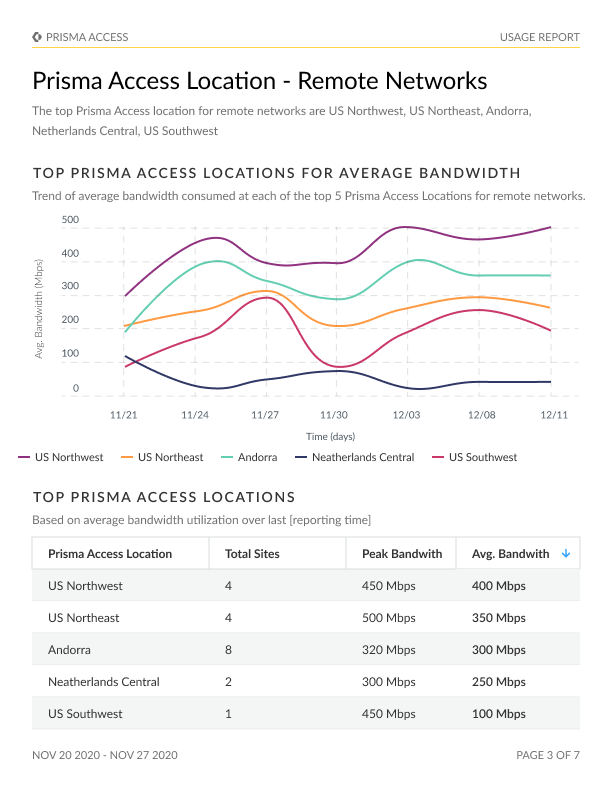
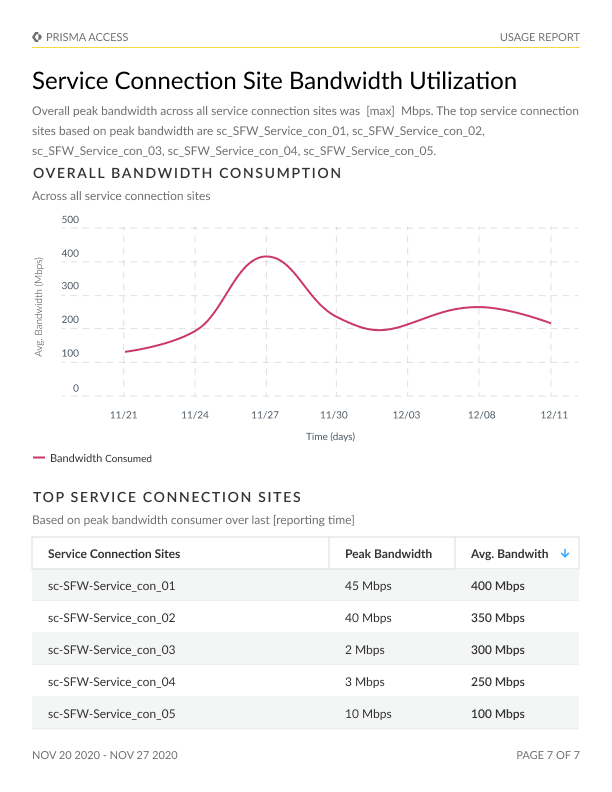
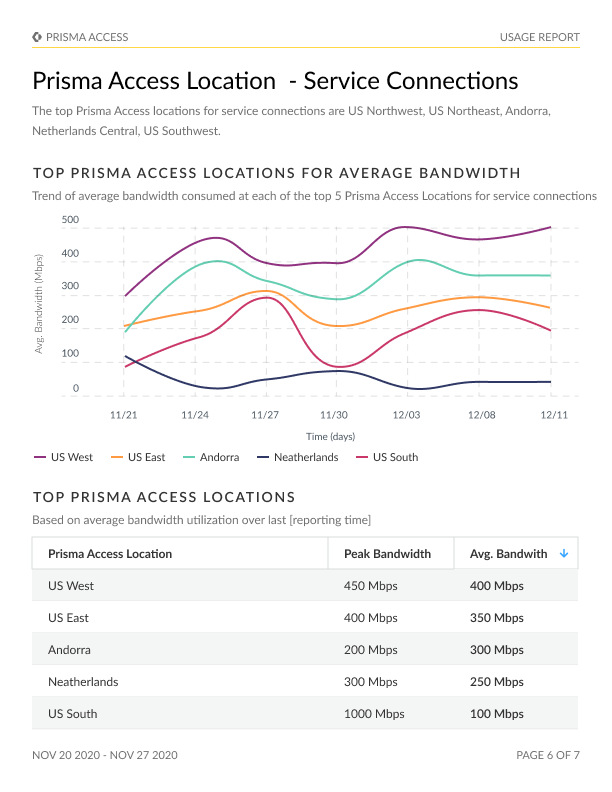
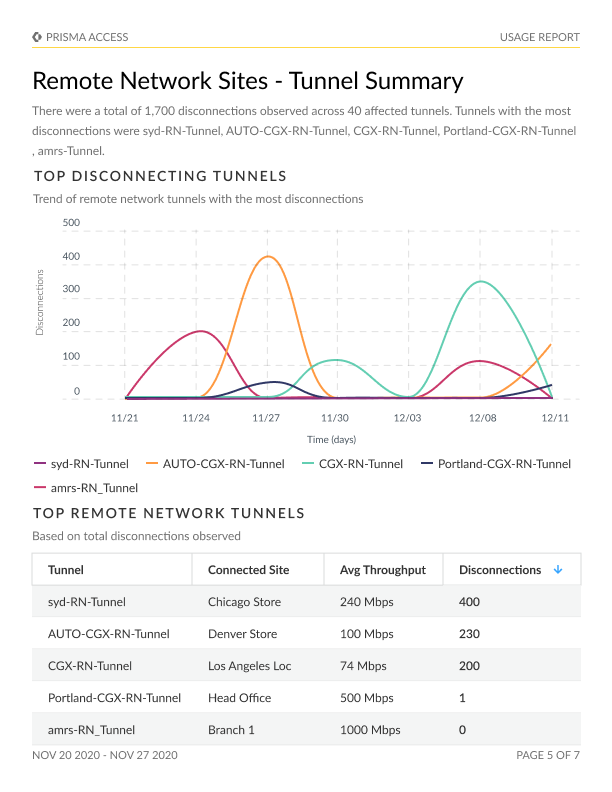
Usage Report
The Usage report enables administrators to embark on an exploration of their Prisma Access environment in an unprecedented manner, offering a comprehensive overview of their license utilization as well as the general health and performance of the setup. Prisma Access Usage data imparts valuable insights, encompassing:
A meticulous breakdown of the Prisma Access usage, covering license utilization, Prisma Access locations, and the capacity or bandwidth utilization for mobile users.
Identification of top Prisma Access locations, with an emphasis on mobile users and remote networks.
Accurate data on bandwidth consumption for remote network and service connection sites, pinpointing the locations with the highest consumption rates.
Illumination of trends in tunnel disconnections, providing insights into the tunnels most frequently affected.
This report empowers users to unveil the genuine potential of their Prisma Access implementation, facilitating well-informed decision-making through a comprehensive high-level analysis of the network.
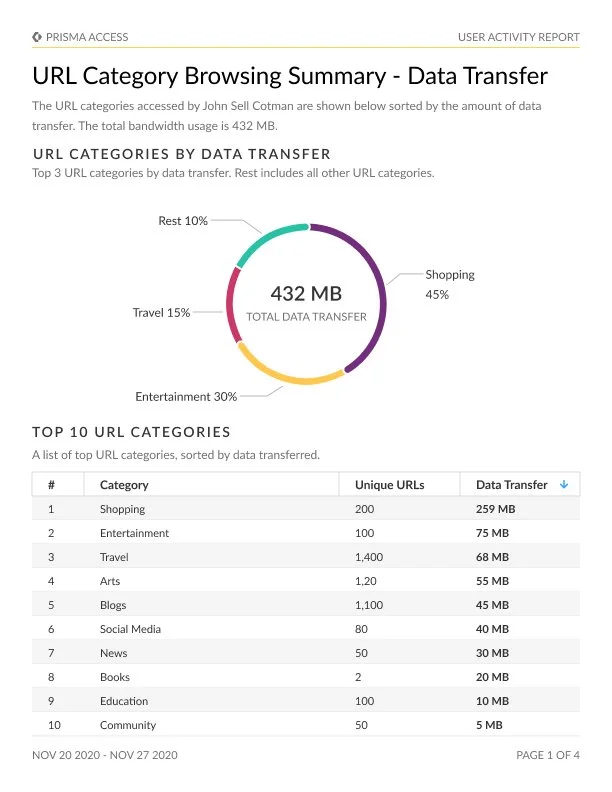
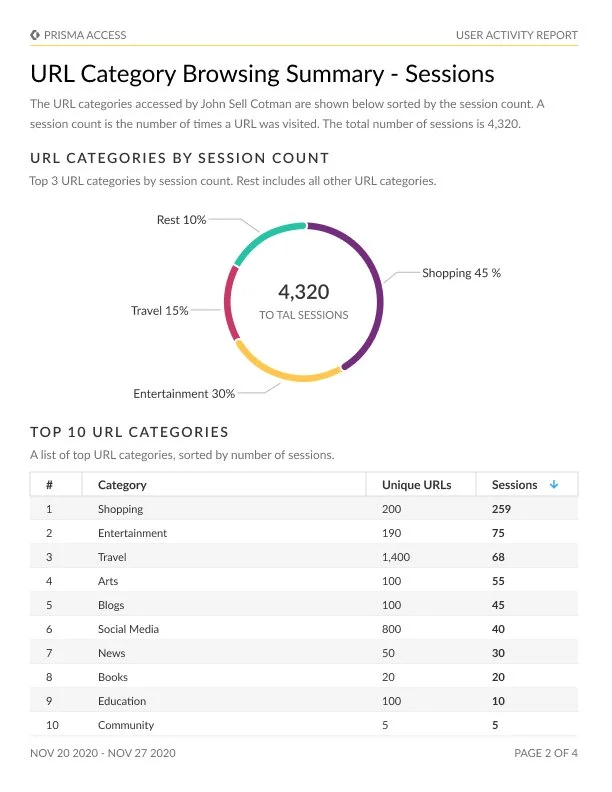
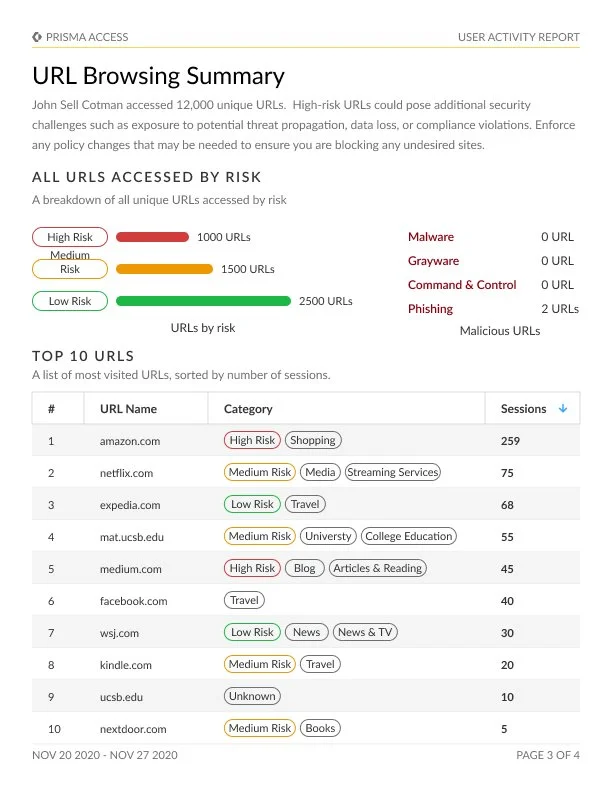
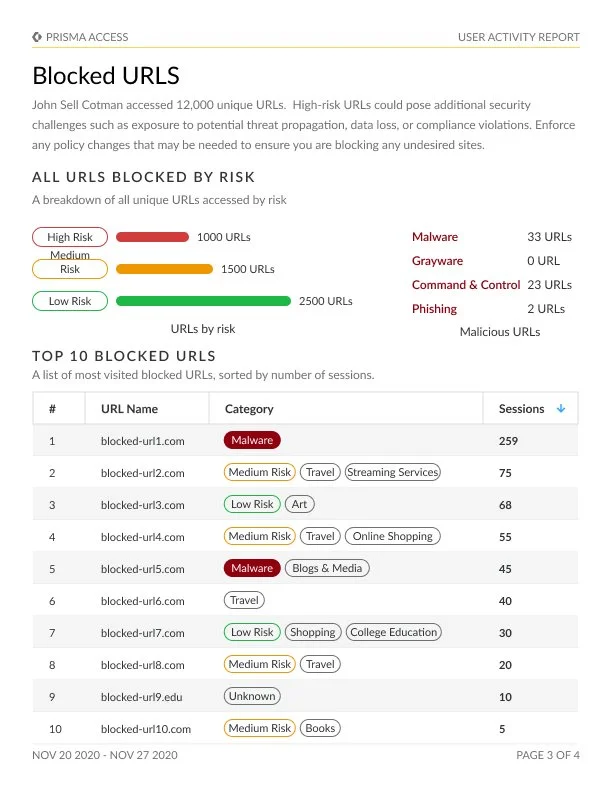
User Activity Report
The User Activity Report unlocks valuable insights into the browsing behaviors of individual users. This exploration encompasses the examination of their most frequented websites, destinations for data transfers, and endeavors to access high-risk sites.
This all-encompassing analysis originates from the data ensnared within URL Filtering logs, thus furnishing an intricate perspective of user web activities. By harnessing the capabilities of the Cloud Identity Engine (Directory Sync), users are afforded the ability to effortlessly access read-only Active Directory information. This enables the filtration and customization of the report to cater to specific users' requirements.